This scenario will give you a guided tour of some relevant features in Zylinc Advanced Statistics. It won't give you exact advice about how to handle a similar scenario in your organization, but it'll provide inspiration about what you can do.

Say that you're a call center manager who prepares for your quarterly performance appraisal meeting with one of your agents. You want to view how the agent has performed lately.
Can Zylinc Advanced Statistics help you find out, based on facts rather than gut feeling? Yes. Here's an example:
-
In Zylinc Advanced Statistics, you select REPORTS > ADVANCED REPORTS, and then click Zylinc.
-
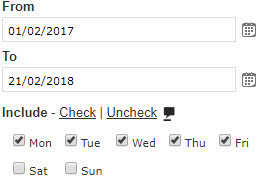
On the Parameters tab's From-To tab, you select the last year, Monday to Friday.
-
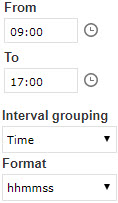
On the Interval tab, you then select the agent's working hours, which are 09:00 to 17:00.
-
On the Report tab, you select User by id.
The report is going to be about a single agent's performance, so you keep the setting that'll group the report's results by the total.
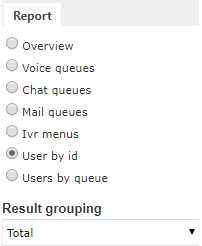
Had the report been about the performance of multiple individual agents, you could have selected to group the report's results by object, which would have resulted in separate lines of information for each agent.
-
On the Report targets tab, you click the icon to select which agent you want the report to cover.
-
Then you click the Execute report button.
In the following, we'll look at how you analyze the report's data to find out if there have been any performance issues that you ought to take up with the agent at the performance appraisal.
Most of your agents work with you in the actual call center. The agent in question, however, is a specialist who works from home. He primarily works on customer projects, but because that workload goes up and down, he also works as an agent on some of your phone queues. As an agent he's highly appreciated, because his specialist background often helps him solve even complex customer inquiries while he talks with the callers.
Once every quarter, you and him have a face-to-face meeting where you look at his agent performance based on data from the past year. Even though he's a valued specialist, you're determined to treat him just like any other agent in your team.
That's why when you evaluate his performance, you look for the same things that you do when you evaluate other agents. That includes, for example, his idle/busy ratio, how much time he spends in wrapup (that's the short break that agents can get after each call, so that they can finish paperwork, etc. before the next call), whether he often changes his status to inactive while on duty, and, if so, his reasons for going inactive.
In the report, you select Year and month view to quickly spot any trends in the agent's activity.

You can see that the agent has answered nearly all of the calls that he got, so that's fine:
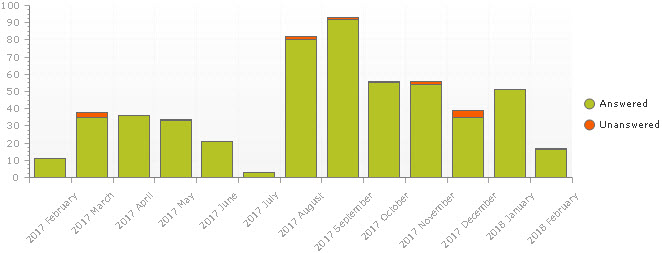
In the report's graph (not in this illustration of the graph), you can place your pointer over a bar in the graph to view the exact values that the bar represents. That way, you'd be able to see that the thin dark line at the top of the 2018 February bar represents a single unanswered call.
You then look at the agent's ring and talk times. The graph has two Y-axes and looks complex, but it's really quite easy to read:
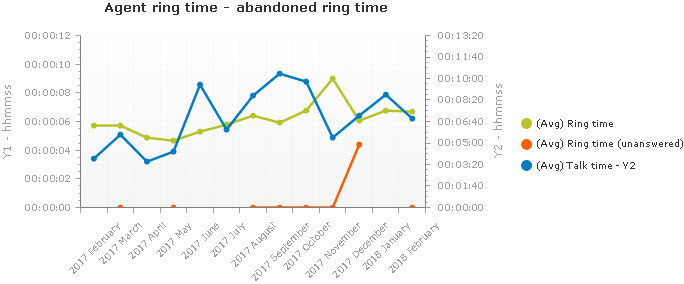
The green line  shows how long the agent's phone has rung on average before the agent answered it. Lately that has been a little less that seven seconds, which is fine for someone who works from home and has other tasks.
The orange line  shows the same, but for calls that the agent didn't answer. Because you know that the agent answered nearly all of his calls, the orange line is of little interest.
The blue line  is more interesting. It shows the average time that the agent has talked when he handled a call. Lately, that has been nearly seven minutes (the talk time values are on the second Y-axis to the right of the graph). Seven minutes is quite long, but it's acceptable, considering that the agent is a specialist who's able to resolve many cases while he talks with the caller.
The agent's ring times and talk times have generally gone up during the past year, but the slight trend doesn't worry you.
An idle agent isn't a lazy one. Idle simply means that the agent is ready to receive inquiries. When the agent gets a call and begins to handle it, the agent becomes busy.
In a call center, you typically want your agents to be busy most of the time, simply because it's their job to handle calls. However, this agent works from home and also works on customer projects, which is reflected in his idle/busy ratio.
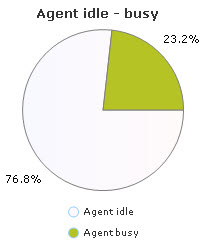
An agent who's only busy 23.2% of his working hours would normally be unacceptable, but in this agent's case it's OK.
In your organization, agents get a 30-second wrapup after each incoming or outgoing call that they've handled. If agents don't need the full 30 seconds, they can manually end the wrapup before time. If agents need more time, they can extend the wrapup with another 30 seconds.
Normally, this works fine. However, you know from previous experience that a few opportunistic agents may consistently extend all of their wrapups to get 60-second breaks between all calls. That's why you routinely check wrapup times when you prepare for performance appraisals.
You click the Columns tab at the top of the report page, and select that you also want to view information about Wrapup. In the table in the lower part of the report, you can now view an extra column about how much time the agent has spent in wrapup.
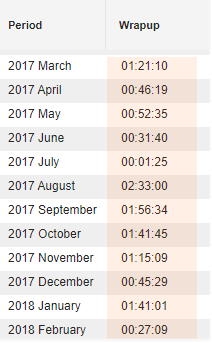
In the previous month, the agent spent 1 hour and 41 minutes in wrapup. You divide that amount of time with the 93 calls that the agent handled that month to find that on average the agent spent 54.6 seconds in wrapup per call.
That's quite a long average wrapup time. Fortunately, you can see that wrapup time is down to an average of 36.9 seconds per call in the current month.
It's still evident, however, that the agent has needed to manually extend his wrapup time after most calls.
You know that, because the agent works from home, he feels that he needs to write elaborate notes to his colleagues about each case that he's handled, and that may explain why he has spent so much time in wrapup.
To be sure, you decide to discuss the agent's need for wrapup time with the him when you meet face-to-face.
While they're on duty, your agents can manually change their status to inactive, for example because they need to use the bathroom, or because they need to take a lunch break.
In your organization's Zylinc solution, you ask your agents to select a reason whenever they manually change their status to inactive. You can view those reasons if you select an additional setting in your report.
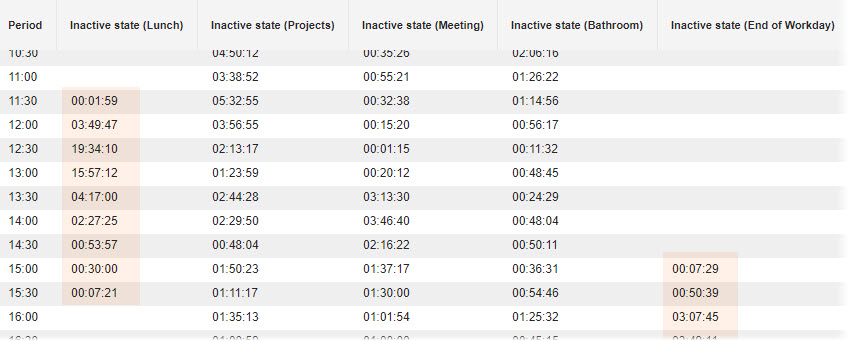
You click the Columns tab at the top of the report page, and select that you also want to view information about Inactive (Agent) - Specification. In the table in the lower part of the report, you can now view some extra columns, one for each of the possible reasons for going inactive.
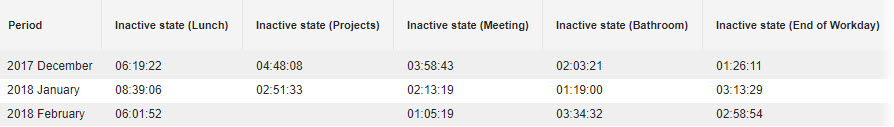
You can see that inactivity because of lunch was up in January, but came down again in February. Inactivity due to meetings has also gone down in the past three months. However, inactivity due to bathroom visits has gone up significantly in the last month.
It's perfectly legitimate for an agent to go inactive for that reason, but you know from previous experience that, for a few opportunistic agents, bathroom visits have gradually turned into long paid breaks, which have in turn resulted in longer queues.
Routinely, you now click the Grouping tab at the top of the report page, and switch to Time view.

You do this to confirm that inactivity related to specific times of the day, for example lunch, actually matches the expected time of day.
Fortunately, you get a picture of a conscientious employee who goes to lunch around lunchtime, and rarely leaves early.
This was an example scenario, and all assumptions in it were made by a fictional character about another fictional character. All organizations are different, and in each case many factors will contribute to the full picture.
In the previous, the fictional call center manager looked at data that it—based on her experience—made sense to focus on. Some things were very evident, for example that the agent needed quite a lot of wrapup time, and that inactivity due to meetings had recently gone down, while bathroom-related inactivity had gone up.
There may be many reasons for that, but if the fictional call center manager combined the data-based observations with her background knowledge about what else had been going on in the organization as well as in the agent's life, she could very likely have made some informed conclusions.
Also, the fictional call center manager looked at quantitative data about how inactivity, wrapup time, etc. may affect queue waiting times. Such quantitative data is vital when you make decisions, but its doesn't tell you about the quality of the service that the agent provides when he talks with a customer. That quality may well be very high, even if waiting times are long.
All in all, this example scenario concerned a seemingly very conscientious agent who had some unusual additional tasks.
This scenario was also meant to give you a guided tour of some of the features of Zylinc Advanced Statistics. If it's made you think about how you can use Zylinc Advanced Statistics for facts-based analysis in your organization, it's been a successful one.
If you're an agent who reads this, keep the following in mind before you begin to worry about your manager's ability to monitor your performance: 1) Your organization must follow data collection legislation, and it'll therefore not collect data that it's not entitled to. The data collected in this scenario were just examples. 2) Any data that your organization does collect will hopefully help prove that you're very good at your work.
This is help for Zylinc version 6.5. To view Zylinc unified help for other versions, go here.
© 2021 Zylinc A/S • Disclaimer
Zylinc unified help is a UK Technical Communication Awards winner 
Help version: 24 February 2021 14:16:14
Share this topic: