Zylinc Advanced Statistics dashboards
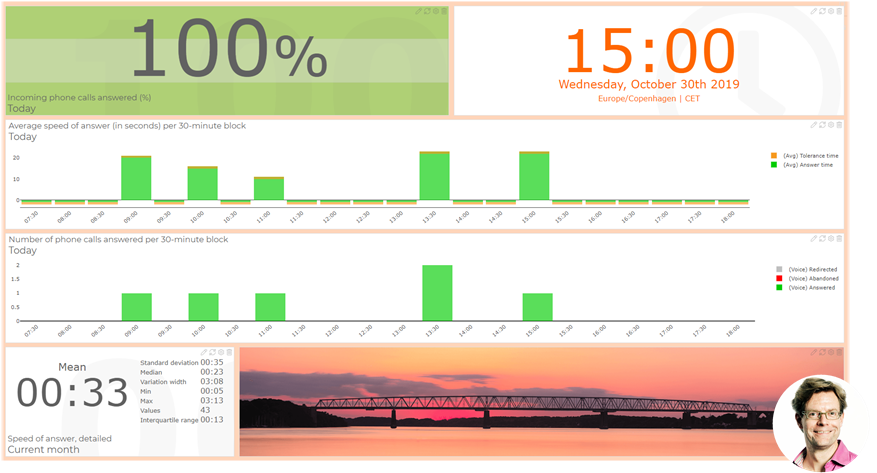
Allow me to introduce myself: I'm the writer who wrote this topic. What you see above is a Zylinc Advanced Statistics dashboard that I have running on a large monitor in my office. It shows my team's ability to answer the calls that we get during the day, and my version of it (this is just a screenshot) updates in real-time. It took me less than five minutes to set it up, including a pulsating green effect that's displayed if we keep answering 100% of our calls, and I didn't even need to create a single report myself to make the dashboard.
In Advanced Statistics, you can easily set up dashboards for operational as well as analytical purposes. Such dashboards are typically displayed in full-screen mode on large monitors in contact centers or IT operations centers, but they can be equally relevant for individual managers, supervisors, etc. to have on their own computers.
In Advanced Statistics, you can make as many dashboards as your organization needs. You can easily customize each dashboard for its particular use, because the dashboards are made up of widgets that you can mix, size, and position as required. You can style the dashboards to make them fit your organization's visual identity, if required with CSS stylesheets.
In addition to information from Advanced Statistics itself, you can add content like RSS feeds, clocks, YouTube videos, images (such as logos), or embedded web pages to your dashboards.
If you already have some dashboards, you can find them on your dashboard list: In the ribbon in the top of the Advanced Statistics window, select DASHBOARDS > DASHBOARD LIST.
If the dashboard list contains many dashboards, use the filter at the top of the page to quickly find a particular dashboard. For example, if you have a Reception dashboard, you can type rec to quickly find it.
From the dashboard list you can also create a new dashboard.
Your dashboard is a quick way to access your primary dashboard, so that you don't need to select it on the dashboard list: In the ribbon in the top of the Advanced Statistics window, select DASHBOARDS > MY DASHBOARD.
The first dashboard that you create will automatically be your primary dashboard. If you create more dashboards later, you can make another dashboard your primary one: Go to the dashboard list, find the required dashboard, and click Set as default.
Here you'll learn how to create a new dashboard from scratch. However, your organization may also offer a dashboard template that you can open and customize to quickly create your own dashboard.
-
In the ribbon in the top of the Advanced Statistics window, select DASHBOARDS > DASHBOARD LIST.
-
At the top of the page, click Create new.
-
Give the dashboard a name, and click Create.
-
Now you can add content. Each piece of dashboard content is called a widget.
- If you want to add content as you go, one widget after the other, click Add content.
- If you know that you want a particular layout for your dashboard, for example 3×3, you can select it on the bottom part of the page. You can then click Add content here in each empty widget in the selected layout.
-
Widgets can contain the statistics that you know from Advanced Statistics reports, but they can also contain other simple or advanced content, such as images or Iframes.
Select the required Widget type, then the required Widget content, and then the required Layout. Even if there's only one layout option, you should still select it.
-
Specify Widget options, that is details about the widget's content. The way that you do that depends on the type of widget that you've selected.
Example: If your widget is about average call duration on phone queues, you'll need to specify which queues you want to view information about. You'll also need to which period of time you want to view information from.
Example: If your widget should display an image, you'll need to specify which image you want.
You can also specify Appearance options, such as background color or text color for the widget.
For some types of widgets you can also specify Warning options to make the widget look differently if a value reaches a particular threshold.
Example: If you have a widget about average answer time on a phone queue, you can make the widget turn red if the average answer time goes above 20 seconds.
If you use the warning options, make sure to select Warning enabled if you want to view the effect on the dashboard.
-
When you're ready, click Add widget.
-
Repeat for each other widget you want to view on the dashboard.
If your organization offers a dashboard template, you'll see a Create new from standard template button at the top of the dashboard list page.
When you click the button, you can make a copy of the template, and modify it to suit your needs.
See the following to learn how to edit an existing dashboard.
Some dashboards may be read-only. When that's the case, you can't edit their layout. Ask your Zylinc administrator if you're in doubt.
-
Go to the required dashboard.
-
You can edit in two ways:
- If you want to edit the layout of the entire dashboard, click Edit content at the top of the page.
- If you want to edit the layout of a particular widget, for example to make it wider, click
 in the top right corner of the required widget.
The second method is often the best choice, because you get the largest number of options, and you can easily edit the layout of other widgets too.
-
Make your layout changes:
-
To move a widget, drag it to the required position
-
To resize a widget, either use the arrows in the bottom right corner of the widget or use the toolbar in the bottom part of the page
-
To add a new row, click
 between the existing rows
If you add an empty row, you get a 10px tall spacer between the rows above and below.
-
To place widgets freely, select Free placement at the top of the page
With free placement, the dashboard won't be responsive for different screen sizes.
-
-
When you're ready, click Save changes.
-
Go to the required dashboard, and click Options at the top of the page.
-
Select Appearance settings.
-
Enable and define Background color and Background image as required.
-
When you're ready, click Save and open to view the result.
If you make a dashboard read-only, you remove the Add content and Edit content buttons in the top part of the dashboard. You also remove the editing options (for example ![]() and
and ![]() ) in the top right corner of the dashboard's widgets, which can make them more appealing to look at.
) in the top right corner of the dashboard's widgets, which can make them more appealing to look at.
- Go to the required dashboard, and click Options at the top of the page.
- On the Standard options tab, select Read only.
- Click Save and open.
Only administrators can do this.
If you're an administrator, you can make a dashboard the default template for all users in your organization. They'll then be able to copy the template and either use it as it is, or modify it to quickly create their own dashboards.
If you want users to be able to use the template as it is, verify that all users have the rights to view the information that the dashboard's widgets contain. If they don't, the widgets will display error messages when users without the necessary rights try to view them. This is why: When a dashboard displays statistics, it technically generates a small-scale report on the user's behalf, and then presents the report's result in a widget on the dashboard. That's why the user must theoretically be able to generate the same report themself. If not, they can't view the result on the dashboard, and then they'll see an error message instead. To learn how to check what users have rights to view, see Manage Advanced Statistics users.
- Go to the required dashboard, and click Options at the top of the page.
- On the Standard options tab, select Use as default template for all users under [name of organization].
- Click Save and open.
Some dashboards may be read-only. When that's the case, you can't edit their widgets. Ask your Zylinc administrator if you're in doubt.
-
Go to the required dashboard, and click
 in the top right corner of the required widget.
 -
You can now edit Widget options, Appearance options, etc. as described in Create a dashboard and add content.
When you edit a widget, you also get access to Advanced options. Those options are primarily interesting for support purposes.
-
When you're ready, click Save changes.
Widgets that contain bar charts or line charts have some extra features that help you analyze the data:
-
 Download plot as png: Save a .png image of the widget's content.
 -
 Zoom: Drag horizontally or vertically inside the widget to define the zoom area.
 -
 Pan: Drag horizontally or vertically inside the widget to move the content along the X- and Y-axes.
The X-axis is the horizontal one, and the Y-axis is the vertical one. In widgets on Advanced Statistics dashboards, the X-axis typically contains a timeline, and the Y-axis typically contains numbers, for example the number of incoming calls.
-
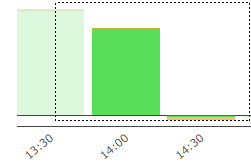
 Box select: Available on bar charts only. Use rectangular shape to select and highlight data.
The shape must cover more than 50% of a bar for the bar to be selected:
-
 Lasso select: Available on bar charts only. Use polygon shape to select and highlight data.
The shape must cover more than 50% of a bar for the bar to be selected:
-
 Zoom in: Click to zoom.
 -
 Zoom out: Click to zoom.
 -
 Autoscale: Fill available space.
 -
 Reset axes: Return to original view.
 -
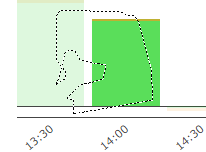
 Toggle spike lines: Switch spike lines on and off.
Spike lines can help you compare spikes and match them with a particular point on the X- and Y-axes:
-
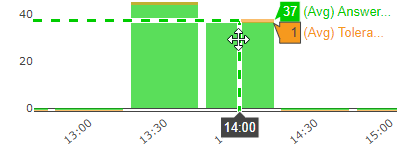
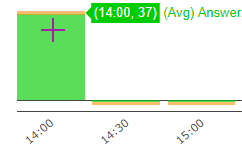
 Show closest data on hover: Show details about the value closest to the pointer.
In this example, the pointer is placed over the green part of a bar, so you only see details about the value that's represented by the green part, even though the bar also has a yellow part:
-
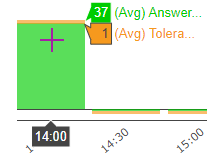
 Compare data on hover: Show details about all represented values when you place your pointer over them.
In this example, a bar represents two values, and you're able to compare them:
This is help for Zylinc version 6.5. To view Zylinc unified help for other versions, go here.
© 2021 Zylinc A/S • Disclaimer
Zylinc unified help is a UK Technical Communication Awards winner 
Help version: 24 February 2021 14:16:14
Share this topic: